Projects
(Update in Progress)
Welcome to my project portfolio! Below are some highlights showcasing my work in data science, analytics, and machine learning.
Walmart Retail Sales Analysis & Dashboard
Queried and processed 3 years of weekly sales data from 45 Walmart stores using SQL to analyze trends and seasonal patterns.
Built a Power BI dashboard to provide actionable insights on store performance, holiday effects, and external factors influencing sales.
Diabetes Risk Factors and Prediction with CDC Datasets
Analyzed CDC data on subjects with and without diabetes to identify key risk factors such as high blood pressure, cholesterol, and BMI.
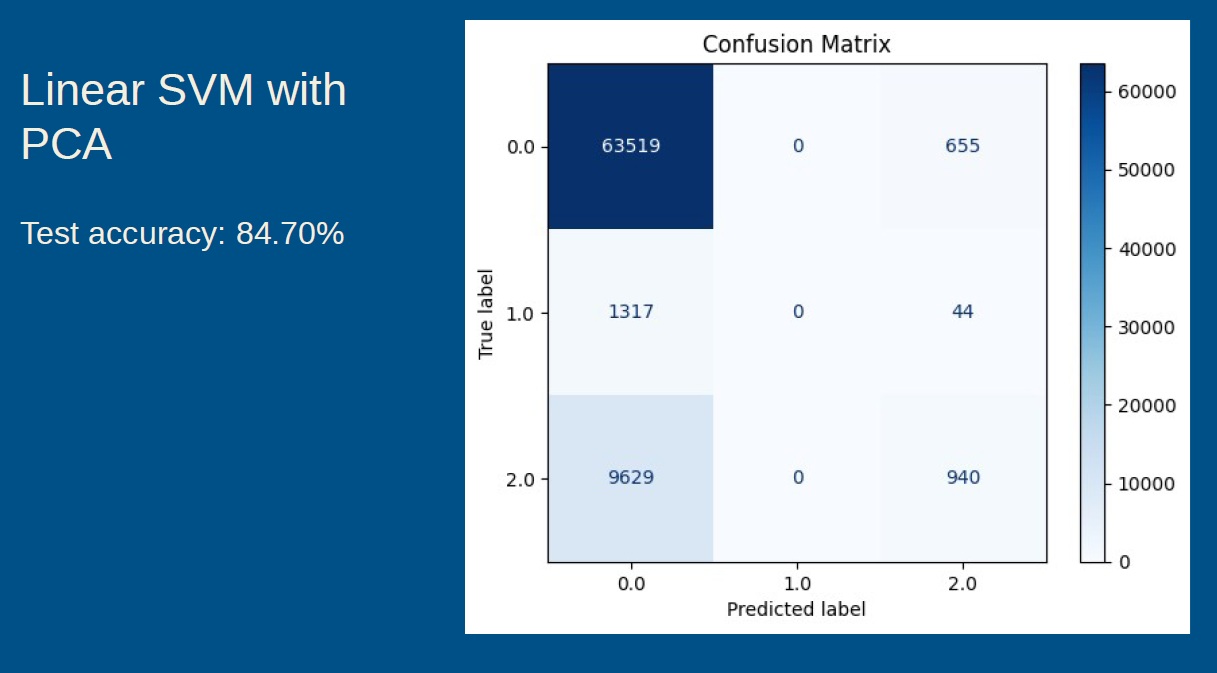
Developed diabetes prediction models using Support Vector Machines (SVM) with SMOTE, achieving 83% accuracy.
HVAC Energy Consumption Project
Improved energy consumption prediction accuracy by 34.7% to reduce operational costs across two buildings.
Utilized XGBoost, identifying air handler duct pressure as the most important feature, and implemented an Isolation Forest alert system to detect anomalies in energy use.
We built a system that helps predict how much energy large HVAC fans will use in commercial buildings. This allowed us to catch when the system was consuming more power than it should, which helped reduce waste, lower operational costs, and identify equipment issues early. In one case, we improved prediction accuracy by over 34%, giving facility managers a clearer picture of their building’s performance and enabling smarter energy management.
Using machine learning models like XGBoost, I trained predictors on data from building sensors, especially air duct pressure, discharge air temperature, and airflow. The most influential variable was duct pressure, which turned out to be the strongest signal for fan energy use.
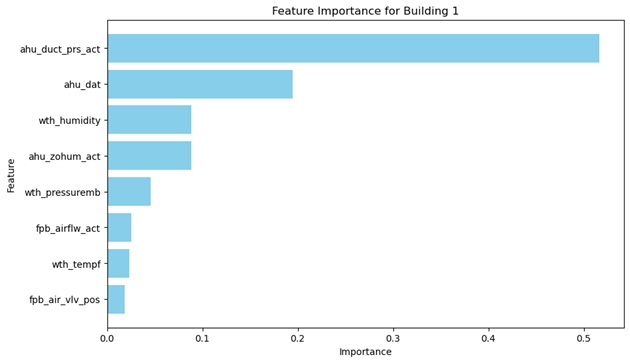
Duct pressure alone explains over 50% of HVAC fan energy use for both buildings in the dataset.
The best-performing model achieved very high accuracy in predicted energy use. It had \(R^2\) scores of 0.97 and 0.96, meaning it explained over 96% of the variation in actual usage, a strong indicator of accuracy. Predictions closely match real-world values across both low and high energy usage scenarios. The average error was just 0.02 \(kW^2\) (measured by Mean Squared Error), showing tight performance even at high fan loads. We also built an alert system using anomaly detection (Isolation Forest) that raised a flag whenever the actual energy use strayed too far from expected (i.e., deviations larger than 0.5 kW), giving operators early warning of potential problems.
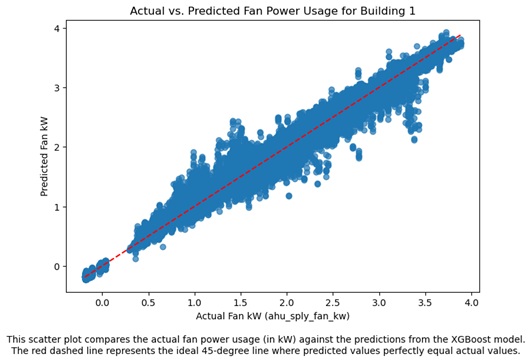
97% prediction accuracy as seen by points following the 45 degree line very closely.
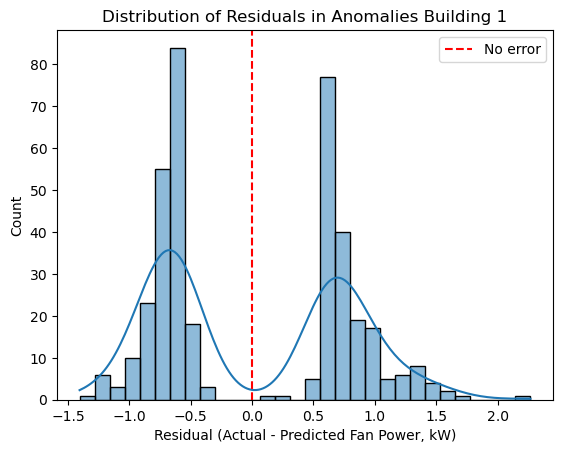
One unexpected finding came from analyzing the patterns in those anomalies. We noticed a distinct bimodal pattern in Building 1’s energy deviations. Most flagged events fell into two groups: one where the fan used significantly more energy than expected, and another where it used less. This pattern suggests the system may be switching between hidden operational modes, like over-supplying versus under-supplying airflow. Identifying this kind of behavior opens the door to smarter diagnostics, not just detecting when something goes wrong, but understanding how and why it drifts from expected performance.